Home About us Support Partners SIGN UP NOW

What is IoT Data Visualization?
IoT Data Visualization

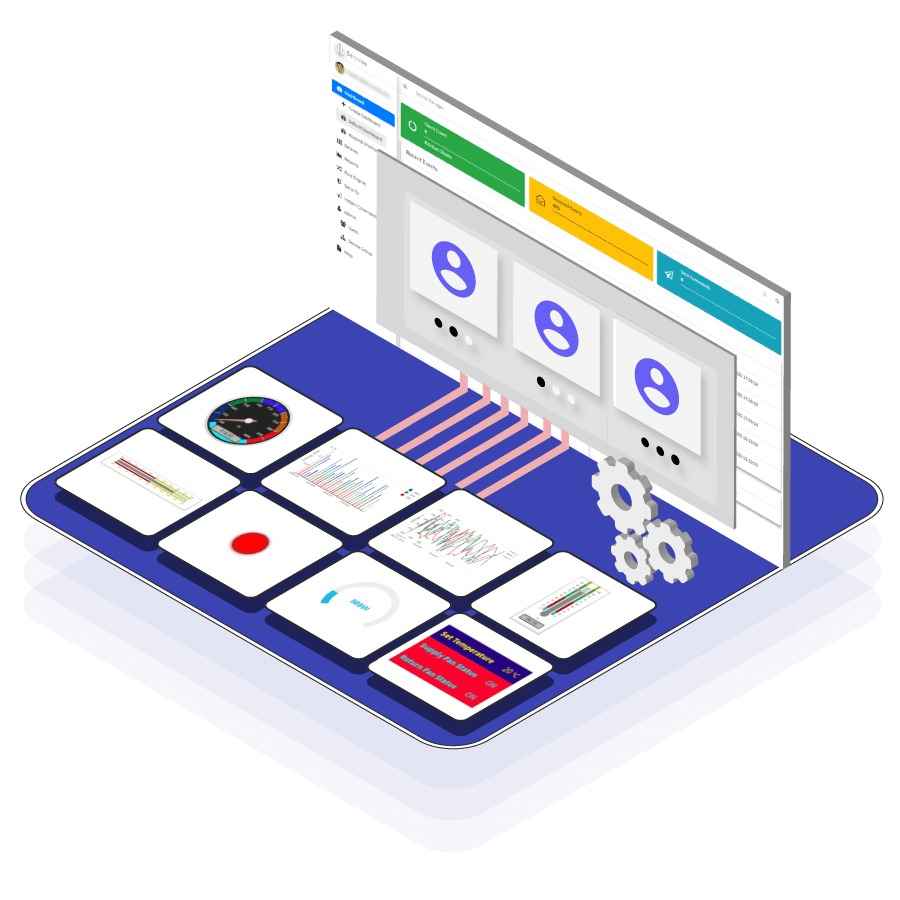
The number of IoT devices being connected, and the rate of data generation, is growing at a staggering 30-40% year over year (YoY). IoT Data Visualization is the method of representing this vast influx of data in visual formats such as charts, graphs, widgets, and dashboards. This approach helps businesses and stakeholders interpret, analyze, and make more data-driven, informed decisions.


The diverse data collected from a wide array of IoT devices enhances the accuracy and effectiveness of these dashboards, making them even more powerful. Commonly used dashboards in industries such as manufacturing, energy & utilities, healthcare, and logistics include real-time dashboards, report dashboards, and trend dashboards, all designed to visualize and understand key metrics.

Visualizing IoT Data Effectively

Misinterpretation of IoT data can lead to misleading insights and costly mistakes. To ensure business success, it's essential to thoughtfully design how each IoT data point is visualized right from the initial planning phase.

Multiple Data Integration

Adopt a Top-Down Approach

Begin with a clear understanding of your business requirements. This top-down approach allows you to drill down into the accumulated IoT data, ensuring that visualizations align with your organization’s goals.

Enterprise App Integration

Embrace Data Understanding

Recognize the interdependencies among data points. This holistic view enriches context and leads to visualizations that accurately reflect the complexities of your IoT systems.

Affordable Pricing

Define Stakeholder Personas

Create detailed personas for your stakeholders, tailoring application screens to their specific needs. This ensures that each user has access to the information that matters most, making dashboards more intuitive and actionable.

In built Rule Engine

Prioritize KPIs

Focusing on the most critical KPIs reduces clutter and enhances clarity. This prioritization enables stakeholders to quickly spot trends and anomalies, facilitating informed decision-making.

Solution Provider IoT Platform

Map Actions to Insights

Establish clear action mappings for each KPI, empowering stakeholders to make informed decisions swiftly. This operational focus ensures that your data visualization serves its ultimate purpose—driving effective actions based on valuable insights.

By integrating these principles into your IoT data visualization strategy, your organization can harness the full potential of its data to drive success.

Our Dashboard Tools for Diversified Use-Cases

Energy Management Dashboard

Energy Management Dashboards

As the cost of energy and natural resources continues to rise due to depletion, energy sustainability is becoming critical for the future of manufacturing and other power-intensive sectors. ISO 50001 outlines standards for effective energy management, ensuring businesses operate efficiently. To align with these standards, key activities to integrate into an Energy Management System (EMS) include:


  • Embedding your enterprise energy policy into the EMS.
  • Measuring current energy utilization in granular detail.
  • Setting consumption targets and actively working towards them.
  • Conducting weekly and monthly reviews to take corrective actions.
  • Engaging key stakeholders for collaboration.
  • Regularly reviewing the energy policy to optimize utilization continuously and improve sustainability practices.

Manufacturing KPI Dashboard

Manufacturing KPI Dashboards

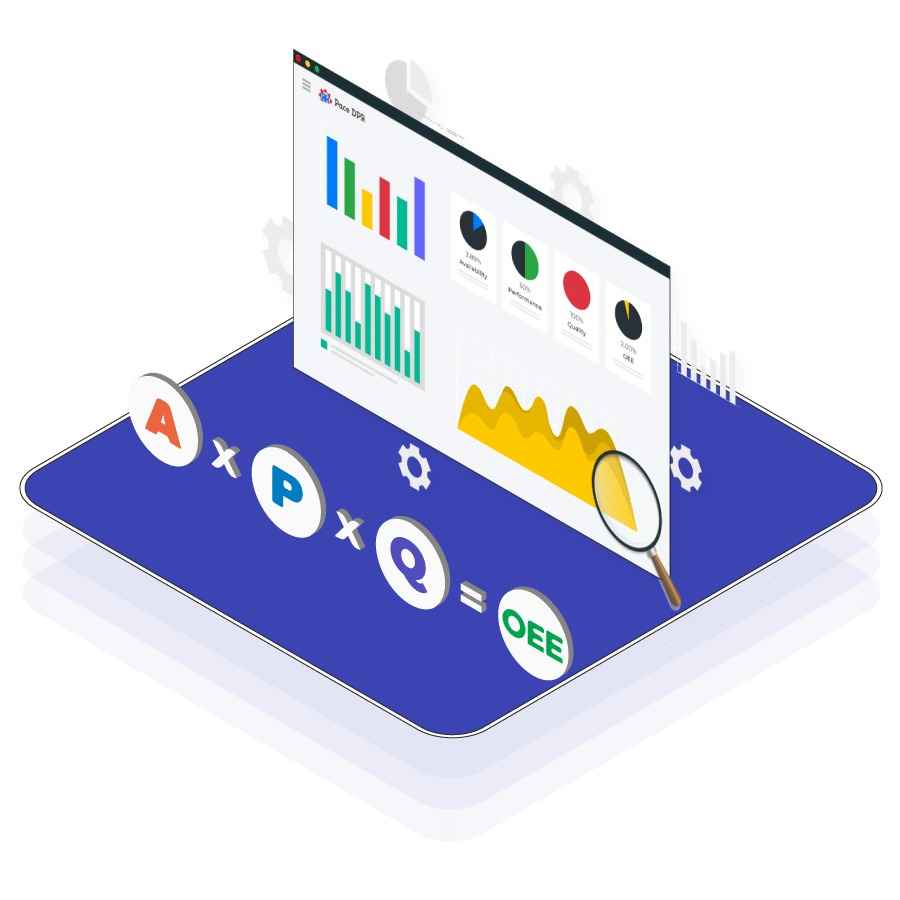
The industry 4.0 version of the Manufacturing execution system is much more powerful with the dynamic collection of data from the OT environment in real time. The Production KPI Dashboards today provides a more transparent state of the shop floor like never before. The live status of the machines, production count, and predictive of maintenance requirements, in association with the ongoing plan and Machine twin AI based dynamic production planning and achieve ability prediction making the Manufacturing dashboards more helpful in decision-making. Plan vs Actual, Production table, capacity utilization, Daily OEE and the trends of the KPIs are most crucial for the execution of the MES System.

Telemetry data Dashboard

Telemetry Data Dashboard

MQTT Protocol is the lightweight protocol defined for telemetry data transport to collect remotely, transfer, monitor, and analyze data. The data collected from the source by measuring some electrical or physical data is sent to the server. MQTT Broker has inbuilt connects for storing it into any third party database and can be visualized as needed.


  • MQTT Broker connector to storage data into Tableau helps analyze & visualization of IOT Data.
  • MQTT Broker Elastic Search integration will help users visualize data via Kibana.

MQTT Broker Dashboard

MQTT Broker Dashboard

Both the on premise and the cloud version of the MQTT Broker has an inbuilt functionality to build multiple dashboards to visualize IOT Data. You will be able to group your devices and create dashboards for these groups. The live dashboards of the MQTT Broker will have the dynamic update of the data on the web user interface. MQTT Broker in addition to dashboard has the functional extendability of data analysis, storage and User interface extensions. The User interface extensions will help you build custom MQTT Dashboard. The reporting dashboard integrated into the solution provider's IoT platform will use a data analytics engine that aggregates raw data into more meaningful insights to aid decision-making.

Efficiently Analyze your IoT Data!

Historical analysis

Historical Analysis

Historical data analysis is important in analysing data from the past to discern specific trends, and compare of your application performance. Historical data is crucial when you are analysing current KPIs of your application to understand trends over time.

Compare Devices data

Compare Devices

When you are intended to compare two different sets of data from two similar devices, a graphical display of data is necessary that shows trends in the form of peak. For example, this is helpful in comparing the performance of machines with standards to check equipment compliance.

 Predict future

Predict Future

The performance (any parameter) of a particular device may vary at different time intervals. For example, such data can be useful in performing root cause analysis, which is to pinpoint trends and conditions of specific equipment in order to identify problems before it’s too late.

Let's get started!

Do you have specific visualization needs for your IoT data?

Reach out for a customized dashboard solution that fits your use case perfectly!