Create Multiple Dashboards
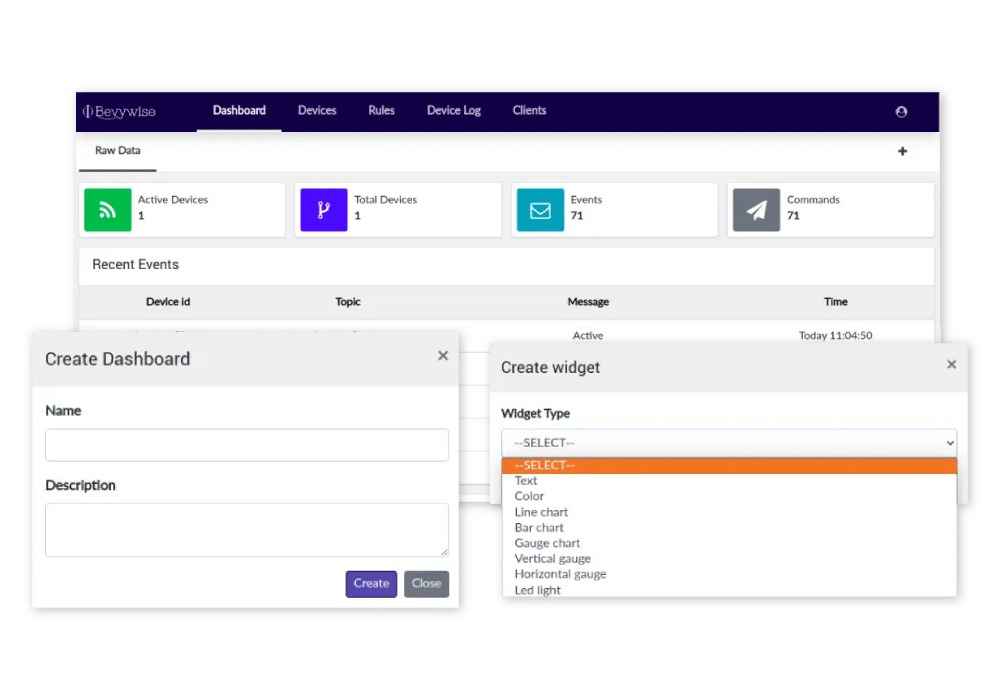
- An exceptionally customizable live MQTT Dashboard to get perfect visuals for your data from MQTT topics.
- Create your own multiple dashboards in minutes for data visualization & remote-device control in real-time.
- No design or coding skills are required. Just lay out the widgets on the dashboard, set up MQTT topics, and relish a stunning and value-bringing picture on the user interface.
- Assign the dashboards to multiple customers of your IoT applications.

Widgets for diversified use-cases
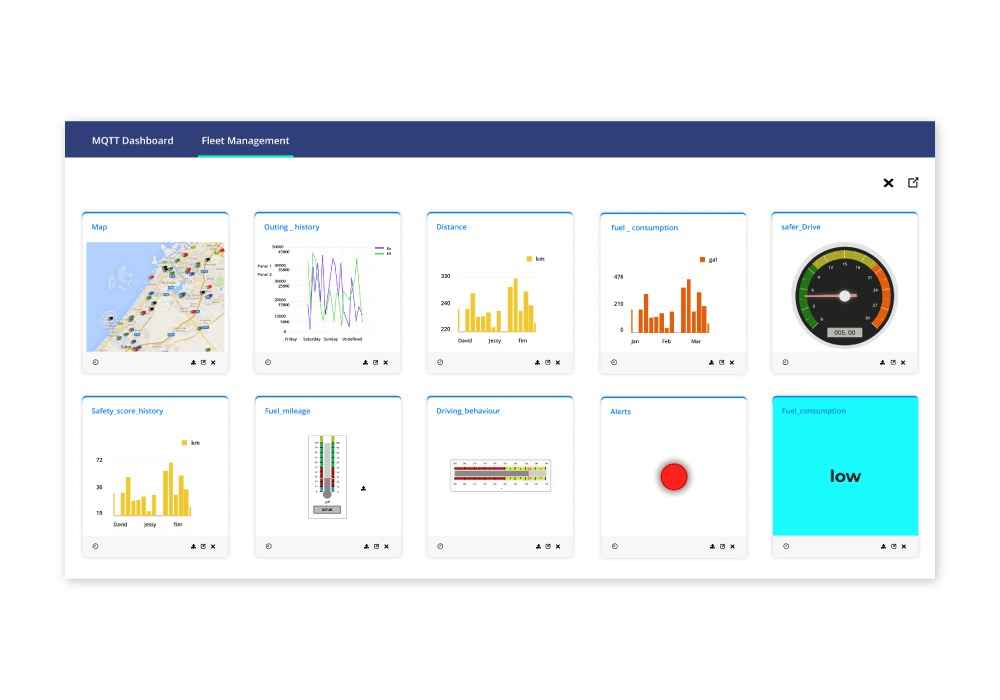
- 10+ live pre-built widgets to create end-user custom dashboards for varied use-cases
- Display anomalies or performance metrics in real-time which helps you make data-driven business decisions by acting on time.
- Scalable to fit all industrial and commercial IoT deployments & implementations.
- Analyze data from the past to discern specific trends, and comparison of your application performance.
- A graphical display of data to compare two different sets of data from two similar devices.

Reports & History Graphs
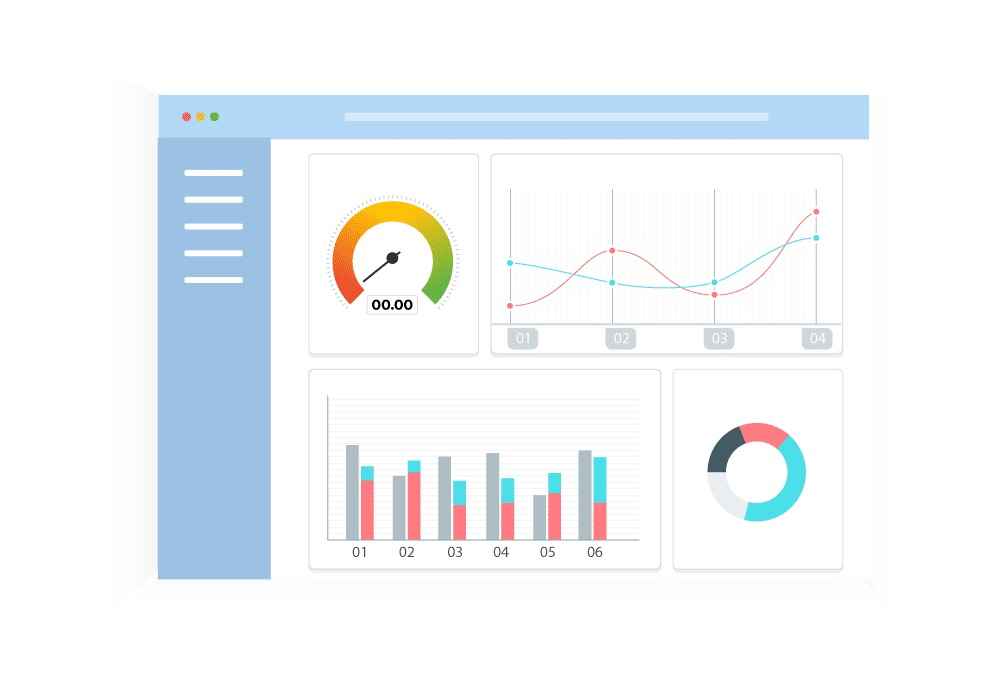
- Built-in visualization to visualize individual device data and topic payloads in real-time in the form of graphs & charts.
- Device to Device comparison graphs to compare two different devices with their data and topic payloads at different intervals.
- 5+ comparison models to generate comparison reports.
- The time comparison graph provides comparison reports for the payload which are published in two different days or months or years.
- Download the reports at anytime in the form of PDF.
Highly Customizable MQTT Dashboard
Looking for a complete IoT Solution for your Industry?
Download Now