Transforming Boring Reports with Data Visualization : Why it matters?
by Ponlakshmi

Reports plays a pivotal role in driving business and industrial growth. They communicate vital information, reveal underlying trends, and provide valuable insights that help organizations make data-backed decisions. Whether it's tracking business performance, evaluating production efficiency, or identifying customer preferences, reports form the foundation of decision-making.
However, despite their significance, reports are often dull and difficult to interpret when presented in plain tables or spreadsheets. Rows of numbers or endless data points may contain valuable insights, but they fail to effectually convey the message due to their lack of visual appeal. Data visualization solves this challenge by transforming static reports into dynamic, easy-to-understand visual narratives.
In this article, we will explore the importance of data visualization, various types of charts, their ideal use cases, and how real-time interactive visualizations are reshaping business intelligence.
Why is data visualization important?
In today's data-driven world, organizations collect and process tremendous volumes of information. However, raw data - no matter how valuable - can be overwhelming. Data visualization acts as a bridge between raw numbers and actionable insights by presenting information in clear, graphical formats.
Here are a few key points highlighting the significance of data visualization:
- Enhances clarity - Complex data sets become easier to interpret when presented visually. Instead of sifting through thousands of rows, decision-makers can quickly grasp key insights from a well-designed chart or graph.
- Speeds up decision making - With visual reports in hand, identifying patterns, trends, and anomalies becomes faster and simpler. This allows teams to make quicker, data-backed decisions.
- Highlights key trends & outliers - Data visualization makes it easier to detect outliers or unusual patterns that might otherwise be missed in tabular reports.
- Improves communication - Visuals are universally understandable. Even non-technical stakeholders can interpret trends and metrics more effectively when they're presented graphically.
- Boosts engagement - Interactive visualizations make reports more engaging and exploratory, giving users the ability to drill down into specific details for deeper insights.
In essence, visual reports are no longer optional - they're essential for effective data communication and business intelligence.
Types of Data Visualizations
Selecting the appropriate visualization is key to ensuring your data tells a meaningful story. Using the wrong type of chart may result in confusion or misinterpretation of data.
When considering how to visualize data, we often instinctively think of line graphs or pie charts. While these two are widely used, they are not always the most effective choice. The right visualization should be paired with the right data to ensure clarity and impact. Fortunately, there are numerous visualization methods that can display data in compelling and insightful ways.
Let's explore various visualization types, their applications, and how they enhance reports:
1. Line Chart
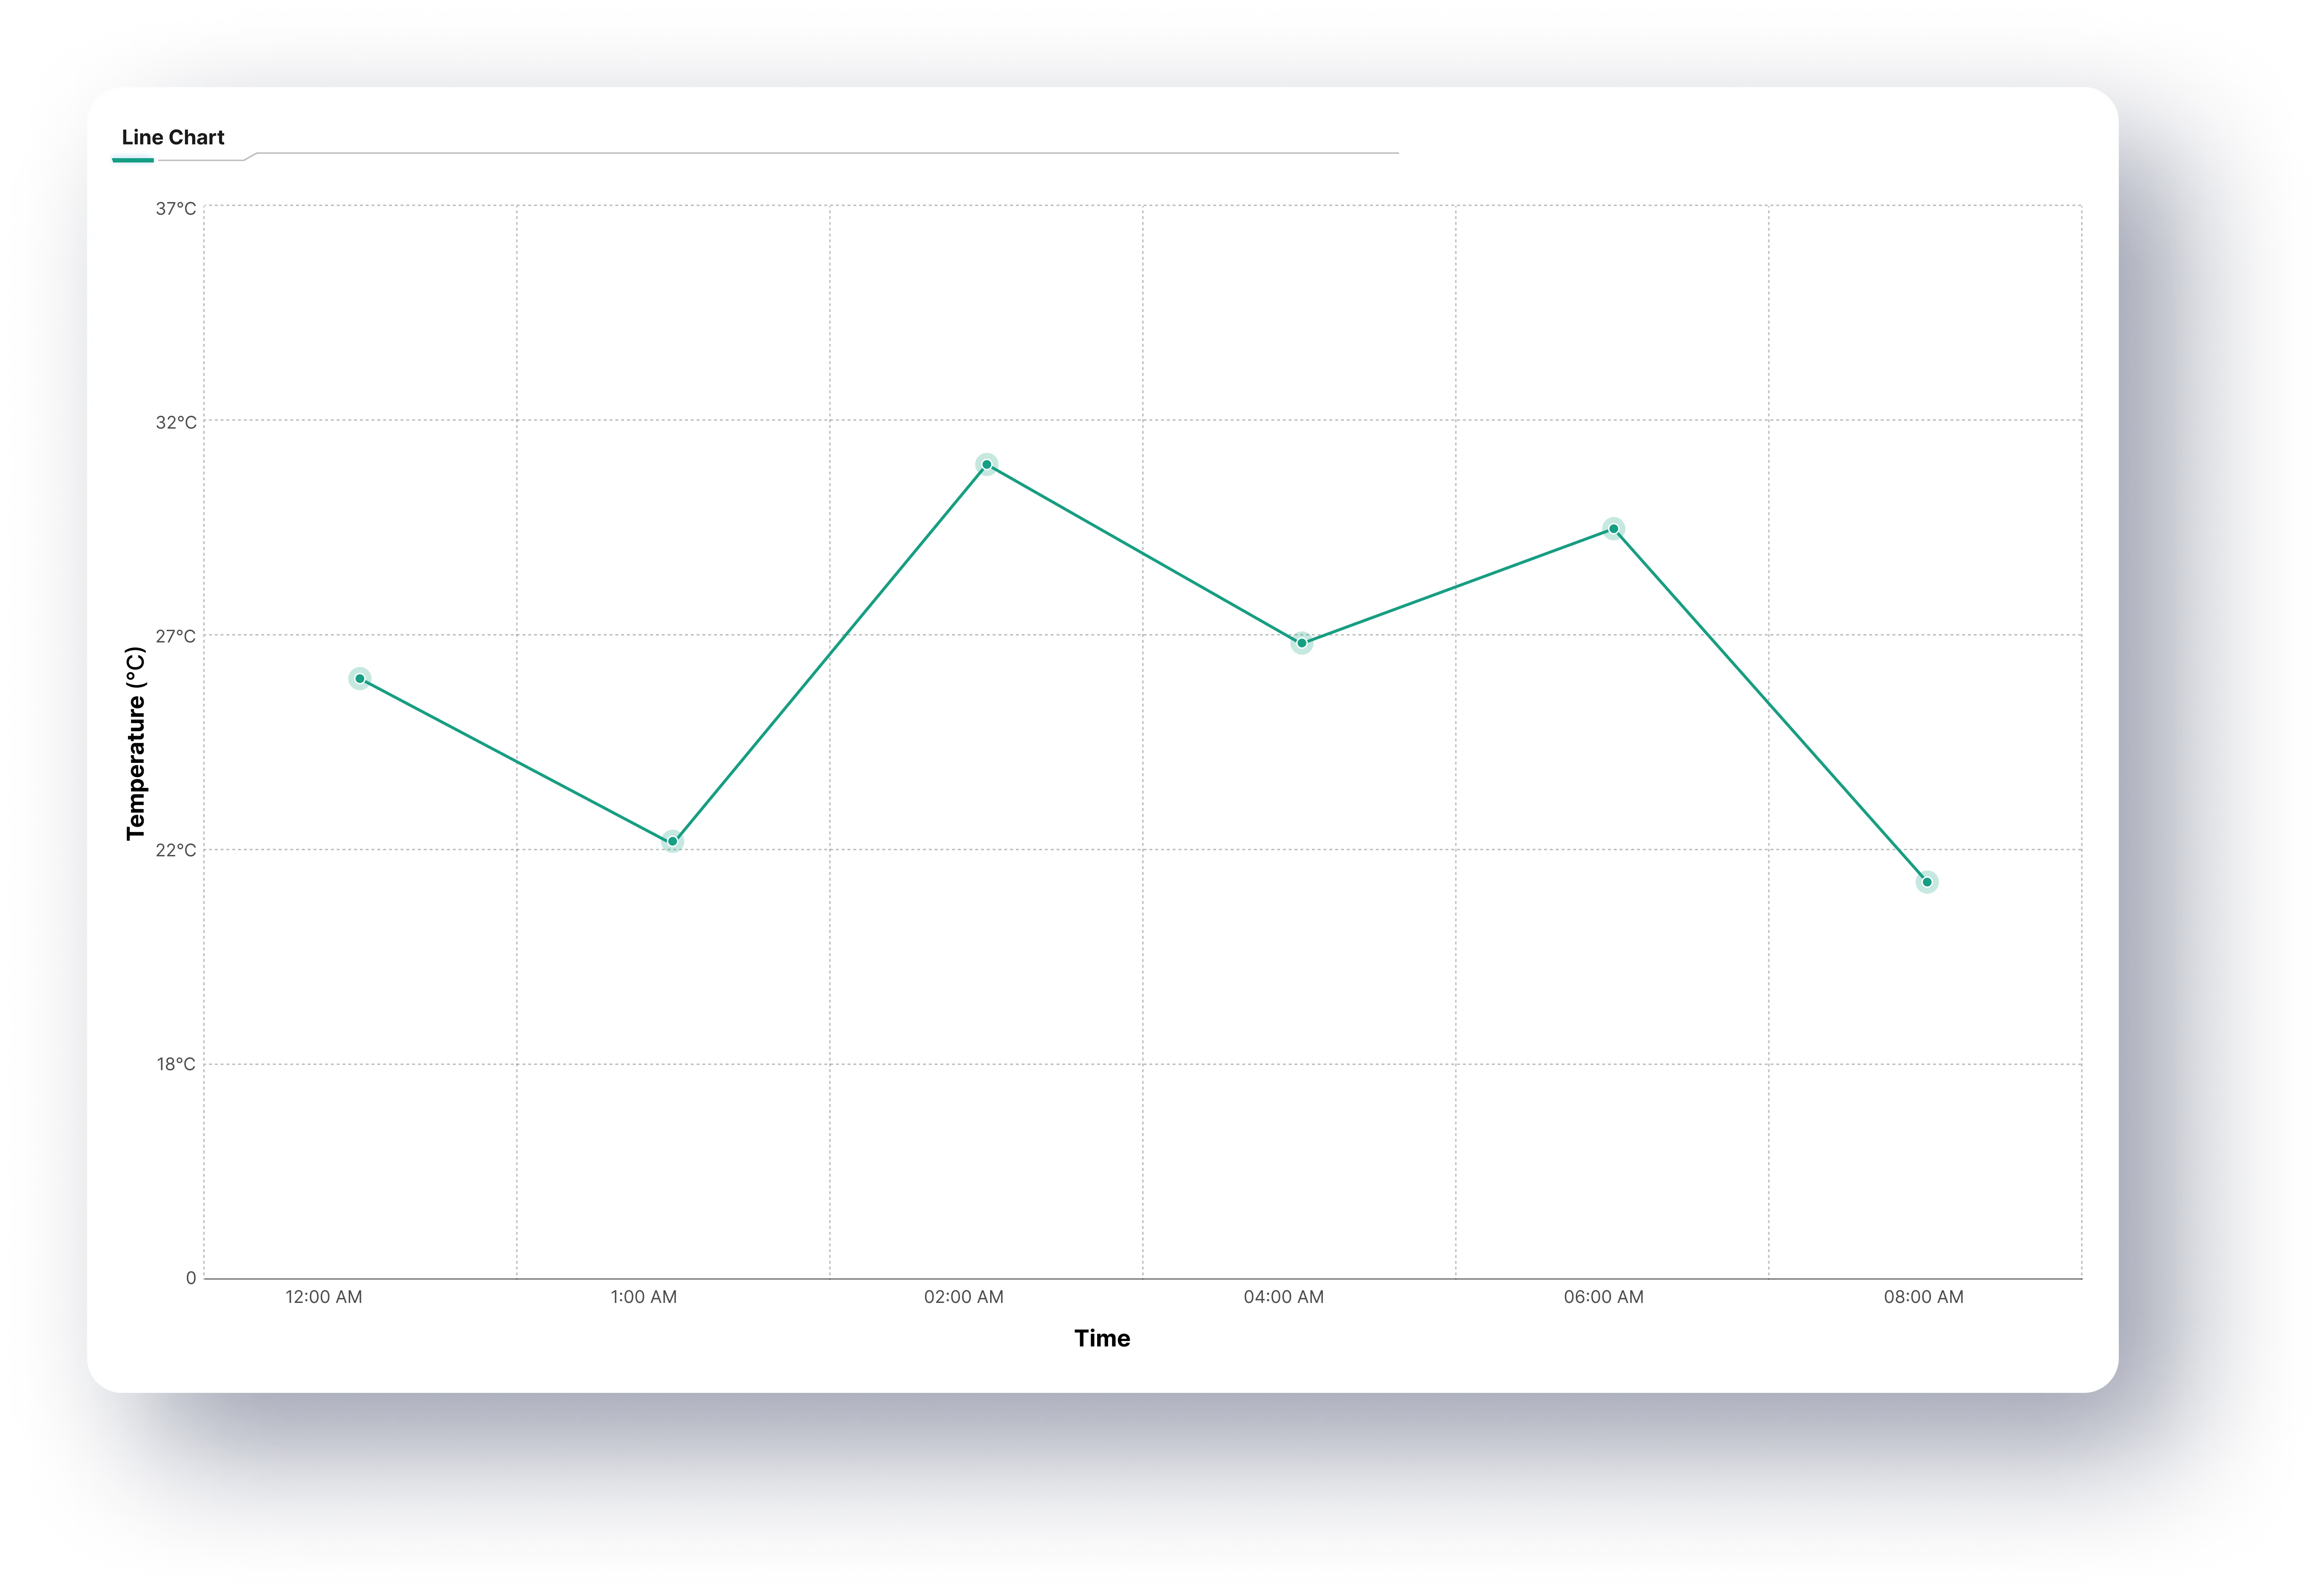
Line charts are perfect for displaying trends over time. By connecting data points with a continuous line, this chart makes it easy to spot patterns, fluctuations, or long-term trends.
Use Case:
- Server room monitoring - Visualizing temperature fluctuations over time to detect overheating issues.
- Sales performance - Tracking monthly or quarterly revenue changes.

2. Bar Chart
Bar charts are widely used for comparing discrete categories or displaying changes over time. They're highly effective when comparing multiple variables side by side.
Use Case:
- Production efficiency - Comparing the output of different production units.
- Marketing campaigns - Analyzing lead generation performance by region.

3. Gauge Chart
Gauge charts are ideal for visualizing progress towards goals or thresholds. They're commonly used to display key performance indicators (KPIs), providing a clear view of whether targets are being met.
Use Case:
- Machine efficiency - Displaying Overall Equipment Effectiveness (OEE) in real time.
- Customer Satisfaction - Showing Net Promoter Scores (NPS) against predefined benchmarks.
4. Doughnut Chart
Doughnut charts are used for part-to-whole comparisons, making them ideal for visualizing proportions or percentage-based data.
Use Case:
- Market share - Representing the distribution of revenue by product category.
- Customer Demographics - Displaying the percentage of users by age group.
5. Pie Chart
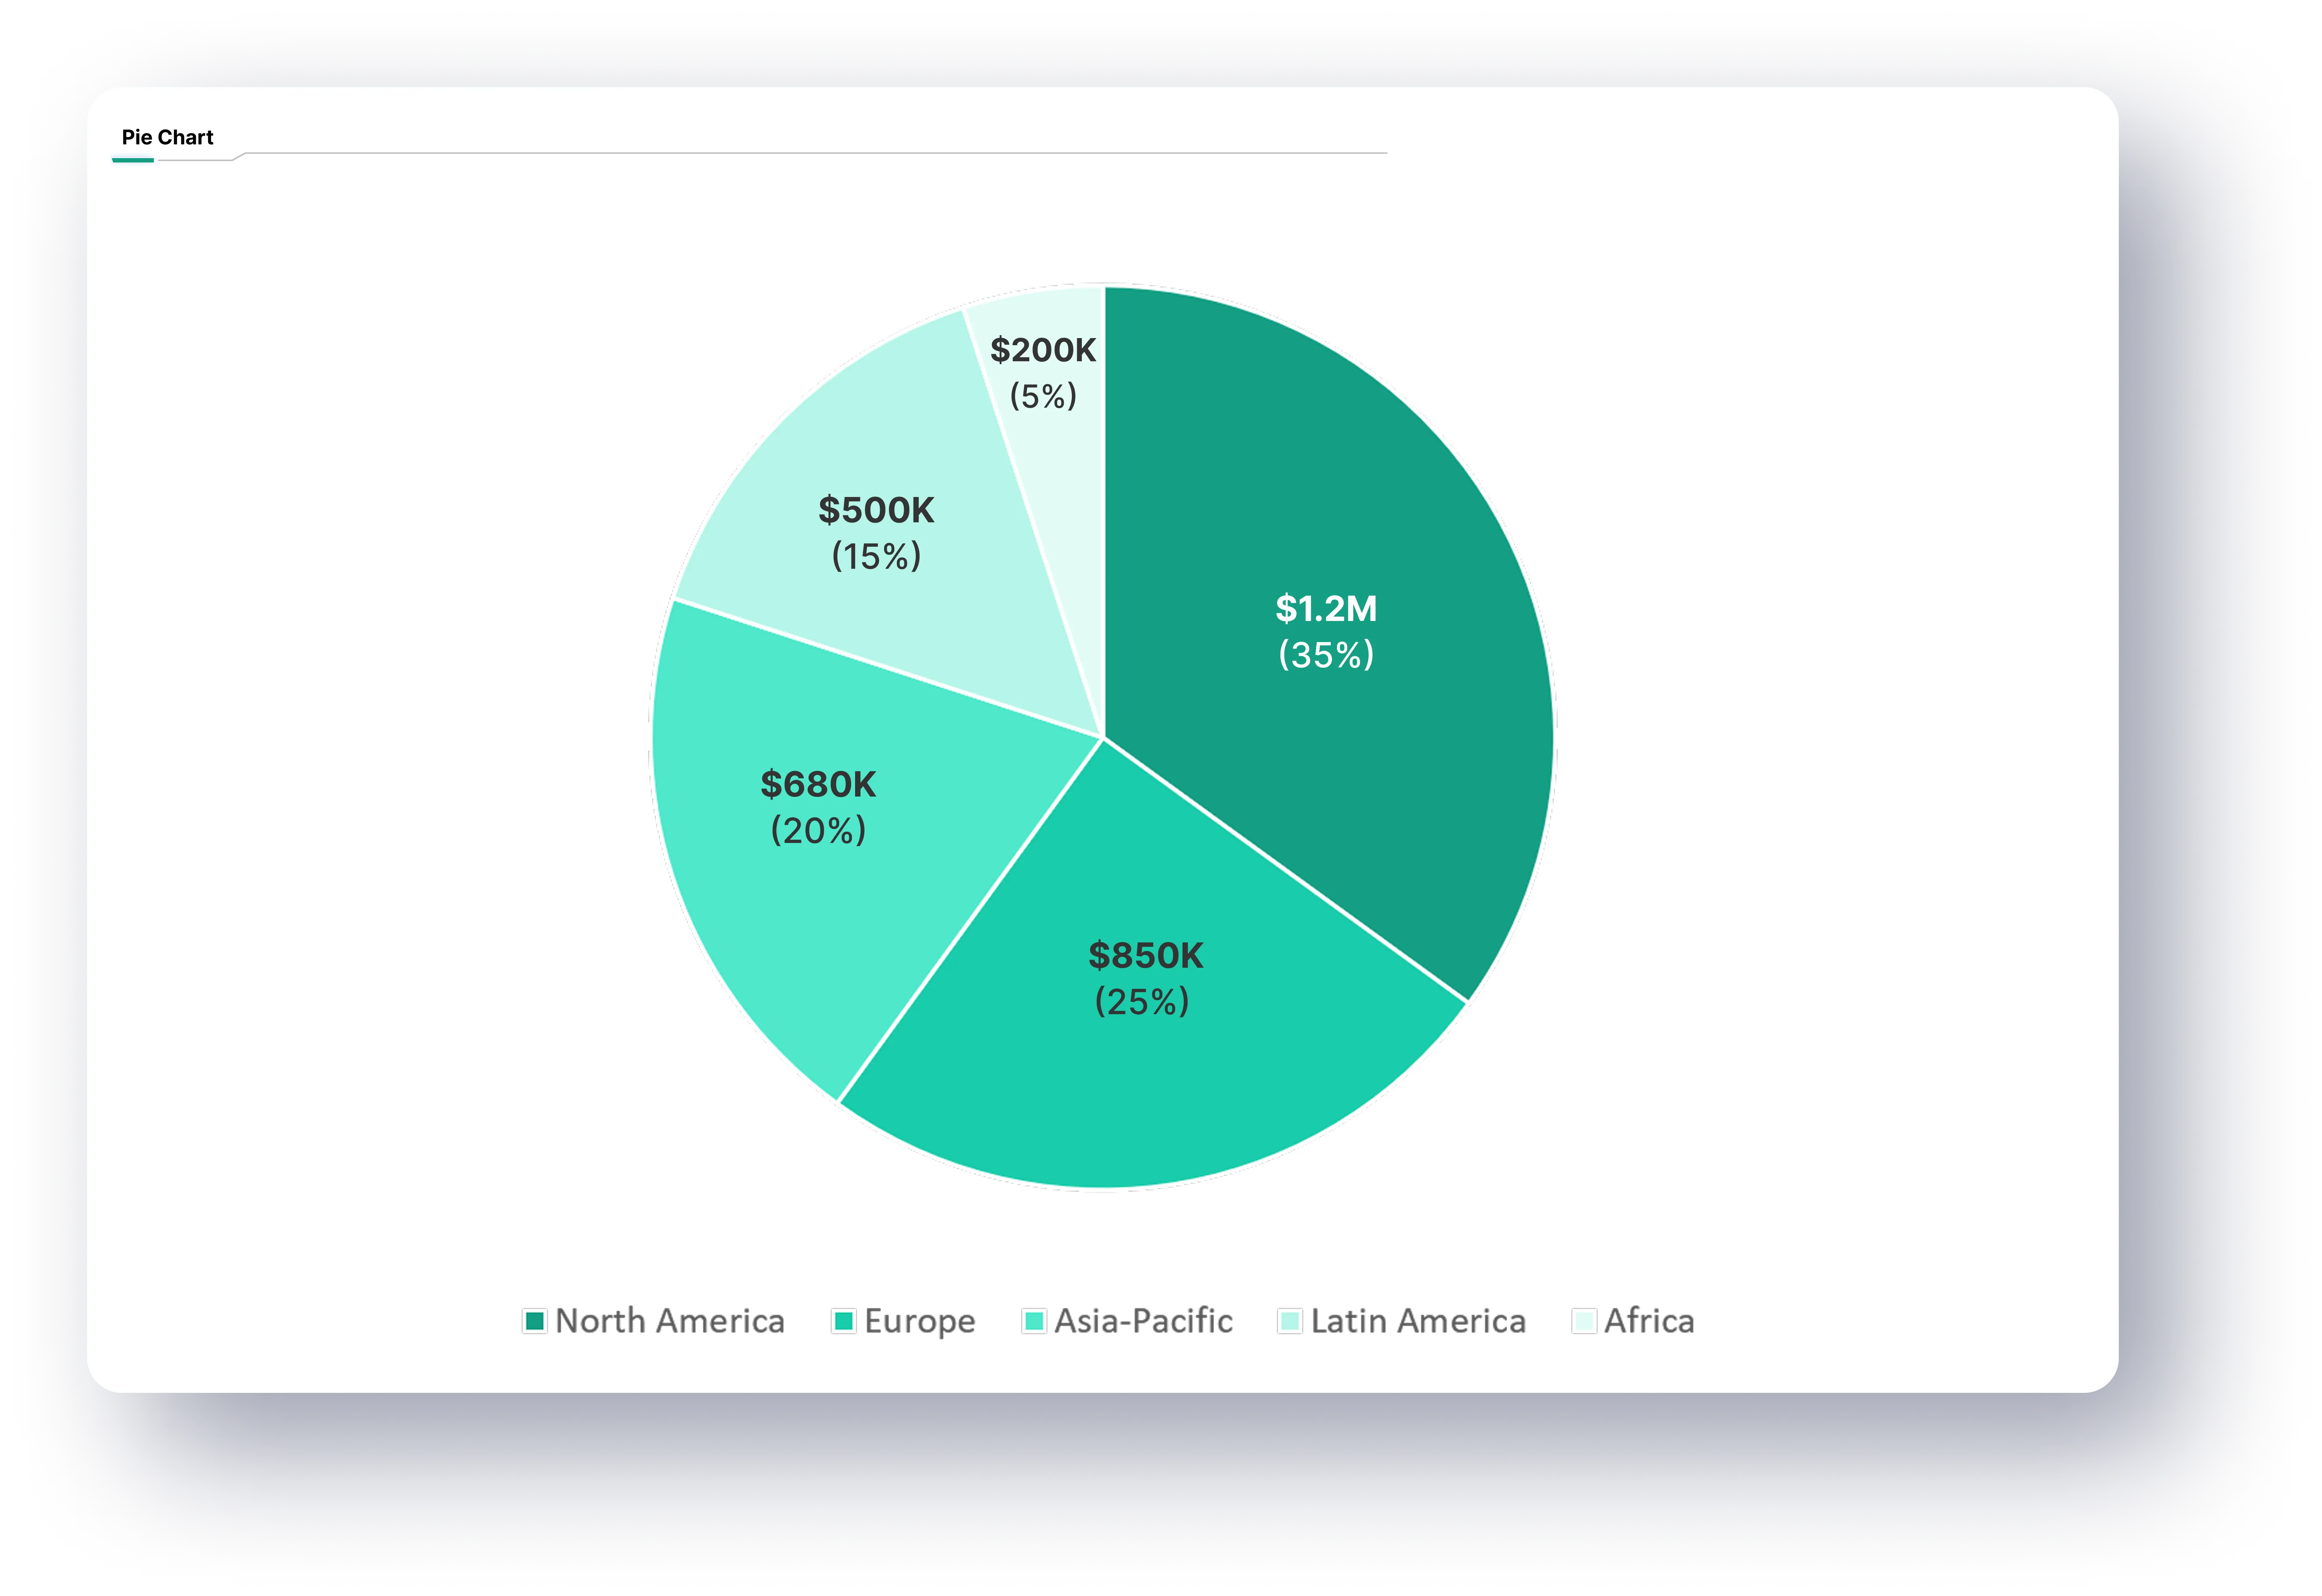
Similar to doughnut charts, pie charts display categorical data as segments of a circle, making them effective for proportion-based visualizations.
Use Case:
- Expense distribution - Showing how budget allocations are divided across departments.
- Sales by Region: Displaying sales proportions by geographical area.

6. Area Chart
Area charts are perfect for representing cumulative data over time. By filling the space below the line, they provide a visual sense of volume or magnitude.
Use Case:
- Website Traffic: Showing cumulative visitors over a month.
- Production Volume: Visualizing total product output over time.
7. Histogram Chart
Histograms are used to depict the distribution of a dataset by grouping data into ranges (bins). They are particularly effective for identifying frequency patterns.
Use Case:
- Customer Purchase Behavior: Displaying purchase frequency across price ranges.
- Quality Control: Analyzing the distribution of defective items.
Advanced Interactive Visualizations
Static visualizations are valuable, but interactive charts take data analysis to the next level. With tools like Power BI, Tableau, and Bevywise IoT Platform, users can click on data points to drill down into granular details.
For example,
- In a sales report, clicking on a region can reveal product-level sales details.
- In production monitoring, drilling into a gauge chart can show device-specific metrics.
- Live dashboards allow users to filter and interact with data in real-time, enhancing the ability to perform ad-hoc analysis.
At Bevywise, we offer real-time, interactive visualizations that enable customers to analyze their IoT data on the fly. This ensures faster decision-making and more informed business strategies.
Real-time Data Monitoring
Real-time monitoring has become a critical component for businesses that rely on continuous data streams. Whether it's tracking industrial processes, IoT devices, or business operations, real-time visualizations provide instant feedback and empower proactive decision-making.
Key Benefits of Real-Time Data Monitoring:
- Instant Anomaly Detection: Identify and respond to issues as they occur (e.g., detecting overheating in machines).
- Improved Operational Efficiency: Monitor production performance in real time to prevent downtime.
- Enhanced Customer Experience: Track service metrics and identify bottlenecks instantly.
At Bevywise IoT Platform, we provide real-time monitoring capabilities with dynamic visualizations, helping our customers gain immediate insights into their operations.
Choosing the Right visualization for your report
Selecting the right chart is just as important as the data itself. Using an inappropriate chart type can lead to misinterpretation and flawed conclusions. Here are some practical guidelines:
- Use line charts for tracking trends over time.
- Choose bar charts for comparing categories.
- Opt for gauge charts to display progress toward targets.
- Use histograms for frequency distribution.
- Implement interactive charts for in-depth analysis.
Bevywise IoT Platform : Advanced Data Visualization Capabilities
At Bevywise, we’ve enhanced our IoT platform with advanced data visualization features, including:
- Individual Device Data: Monitor metrics for individual devices.
- Device-to-Device Comparison: Compare the performance of multiple devices.
- Historical Analysis: Review past trends with historical comparison charts.
- Real-Time Data Monitoring: Visualize live data streams with automatic updates.
- Interactive Charts: Click-to-drill capabilities for deeper insights.
Unlocking insights with data visualization
Data visualization is no longer just about making reports look attractive—it’s about making them meaningful and actionable. Whether you’re tracking business KPIs, monitoring industrial operations, or evaluating customer behavior, using the right visualizations enables faster, smarter decisions.
With Bevywise IoT Platform’s real-time and interactive visualization capabilities, you can transform complex data into clear, actionable insights that drive growth. Try our platform for free and enhance your data visualization to make smarter, data-driven decisions.
Contact our team for any further assistance.